Investment Breakdown
Kalispell has a price-to-rent ratio of 38.1x, which indicates renting is more favorable than buying.
The estimated cap rate of 1.4% is below average, typical of appreciation-focused markets.
Year-over-year price growth of -0.3% suggests a cooling market.
Rental Cash Flow Analysis
Monthly Income
Est. Monthly Expenses
Price Forecast 2026–2028
🔮 Kalispell Price Forecast 2026–2028
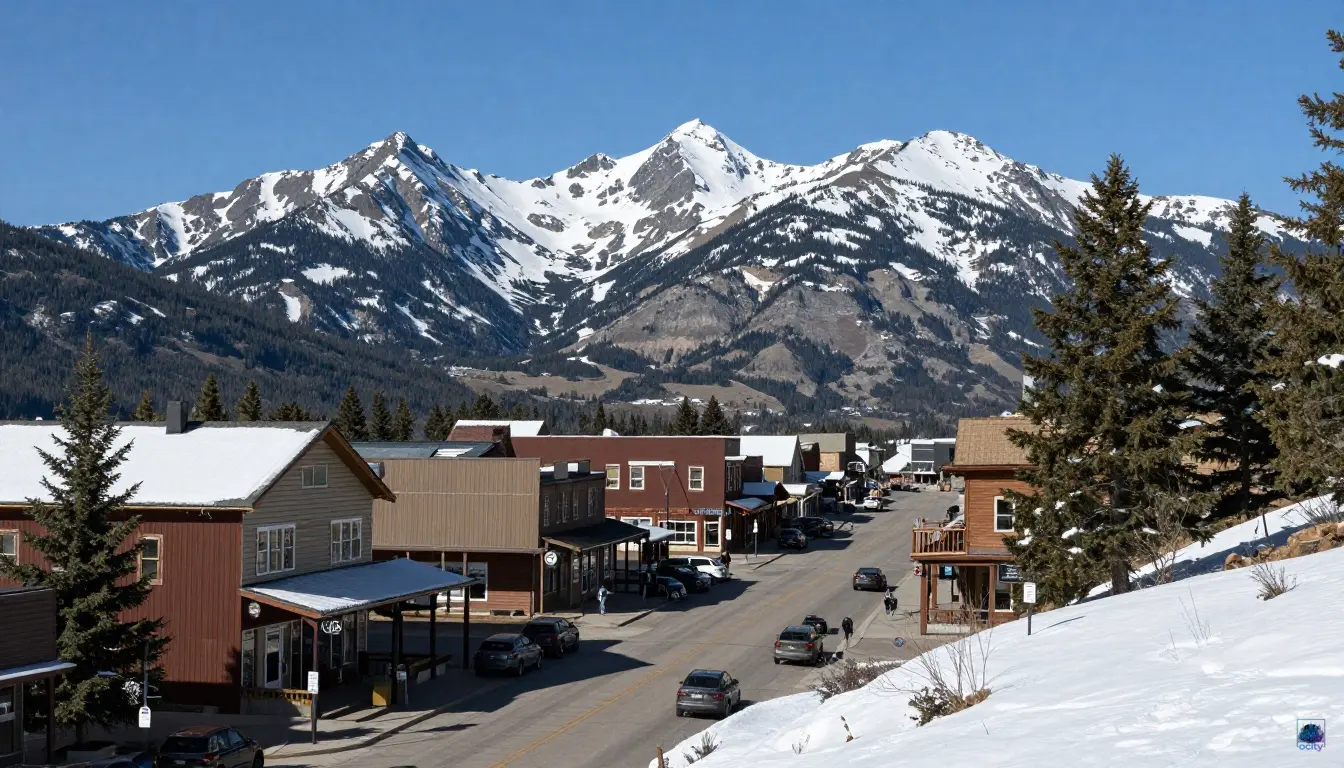
For those analyzing the Kalispell housing market forecast through 2028, the data suggests a period of consolidation rather than the explosive growth seen in prior years. With the median price at $538,312 and a recent YoY change of -0.3%, the market has effectively plateaued after a remarkable 5-year run that saw prices climb 49.0%. The sharp cooling is largely a function of affordability constraints. The price-to-rent ratio sits at 36.9x—nearly double the national average—which signals that the financial math heavily favors renting over buying in the near term. While the local economy remains buoyed by tourism and a steady influx of remote workers seeking mountain lifestyle amenities, the rapid appreciation has outpaced local income growth, creating a ceiling for further price surges in the immediate future.
When asking will Kalispell home prices drop significantly, the risk profile suggests otherwise. With a Risk Grade of A and a Market Temperature of 60/100, the fundamentals remain healthy despite the valuation stretch. Inventory is moving at a reasonable pace of 35 days, indicating that while the frenzy has subsided, there is still consistent demand. The 5-year CAGR of 8.2% provides a buffer against a crash, suggesting that any correction will likely be shallow and gradual rather than abrupt. For the Kalispell real estate Kalispell 2027 outlook, expect a "soft landing" scenario where prices stabilize or see modest single-digit appreciation. The "Buy/Rent" verdict of RENT reflects the current premium on ownership; however, for long-term holders who can weather short-term volatility, the area's enduring appeal as a Rocky Mountain gateway offers solid equity potential over the three-year horizon.
Job Market
Healthcare
Risk Factors
Market Activity
Market Position
Similar Markets Compare with cities of similar size & cost
South Portland
Middletown
Kahului CDP
Newport
Newark
Showing cities with similar population (13k - 40k) and cost of living index (82 - 124)
ROI Projector Estimate your total return
Adjust the sliders to model different investment scenarios for Kalispell.
* Estimates based on 0.0% annual appreciation, 3% rent growth, 5% vacancy. Does not include closing costs, tax benefits, or capital gains tax. For illustrative purposes only.
Rental Investment Calculator Estimate your monthly cashflow
Rental Income Estimator
Pre-filled for Kalispell
Property
Financing
Expenses
Monthly Breakdown
Investment Summary
Disclaimer: This analysis is for informational purposes only and should not be considered financial advice. Investment decisions should be made after consulting with qualified professionals. Data sources include Zillow, Census Bureau, and BLS. Cap rates and yields are estimates based on available data.
Last updated: June 2026