Investment Breakdown
Richardson has a price-to-rent ratio of 22.2x, which indicates renting and buying are roughly equal.
The estimated cap rate of 2.1% is below average, typical of appreciation-focused markets.
Year-over-year price growth of -3.3% suggests a cooling market.
Rental Cash Flow Analysis
Monthly Income
Est. Monthly Expenses
Price Forecast 2026–2028
🔮 Richardson Price Forecast 2026–2028
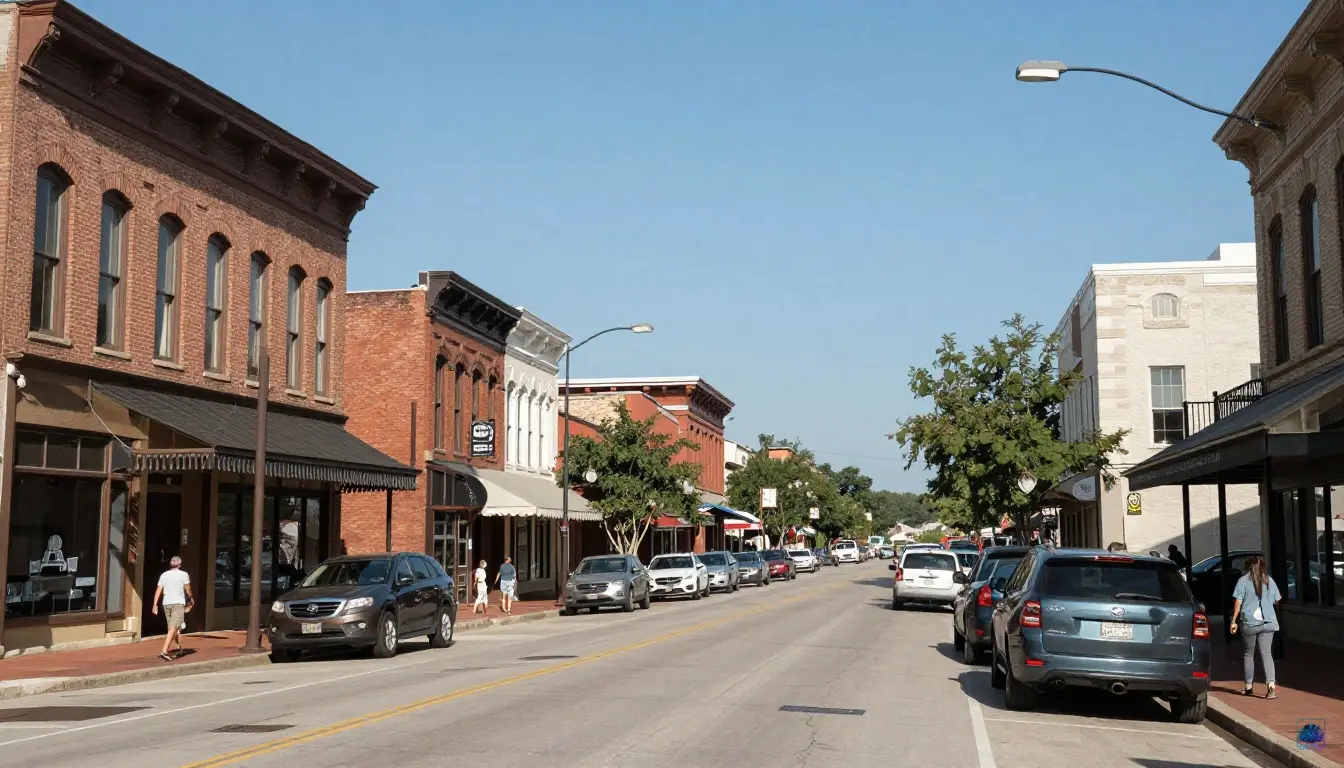
For anyone asking "will Richardson home prices drop," the data suggests a period of stabilization rather than a steep correction. The recent -2.6% YoY price change signals a cooling phase after a robust 5-year run that saw prices climb 32.2%. This moderation is a natural response to affordability pressures, highlighted by a price-to-rent ratio of 24.6x, which is notably above the national average and currently tilts the "Buy/Rent Verdict" toward RENT. With a market temperature of 62/100, the pace is balanced but leaning slightly in favor of tenants. This Richardson housing market forecast anticipates that while explosive growth is unlikely, the strong "A" risk grade and Richardson's position within the dynamic Dallas-Fort Worth metroplex provide a solid floor for valuations. The local economy, anchored by the Telecom Corridor and a diverse tech and education sector, continues to support housing demand, even as higher interest rates test buyer endurance.
Looking toward 2026-2028, the Richardson real estate market is poised for steady, albeit more subdued, appreciation. The 5-year CAGR of 5.7% sets a realistic benchmark for future performance, suggesting that prices will likely trend upward at a single-digit pace rather than double-digit surges. Days on market currently sit at 45, indicating that well-priced homes still attract attention, but the frenzy has subsided. For the Richardson 2027 outlook, affordability will remain a central theme. As the area continues to benefit from corporate relocations and infrastructure improvements, demand should persist, but the high price-to-rent ratio may cap how quickly prices can climb without wage growth catching up. Ultimately, while the market is unlikely to crash, it is also not primed for the rapid gains of the recent past. A balanced assessment suggests Richardson will offer a more stable, less volatile environment compared to the national average, appealing to long-term homeowners rather than short-term speculators.
Job Market
Healthcare
Risk Factors
Market Activity
Market Position
Similar Markets Compare with cities of similar size & cost
Elgin
League City
Manchester
Westminster
Allen
Showing cities with similar population (59k - 176k) and cost of living index (83 - 124)
ROI Projector Estimate your total return
Adjust the sliders to model different investment scenarios for Richardson.
* Estimates based on 0.0% annual appreciation, 3% rent growth, 5% vacancy. Does not include closing costs, tax benefits, or capital gains tax. For illustrative purposes only.
Rental Investment Calculator Estimate your monthly cashflow
Rental Income Estimator
Pre-filled for Richardson
Property
Financing
Expenses
Monthly Breakdown
Investment Summary
Disclaimer: This analysis is for informational purposes only and should not be considered financial advice. Investment decisions should be made after consulting with qualified professionals. Data sources include Zillow, Census Bureau, and BLS. Cap rates and yields are estimates based on available data.
Last updated: June 2026