Investment Breakdown
Sandy has a price-to-rent ratio of 33.3x, which indicates renting is more favorable than buying.
The estimated cap rate of 1.2% is below average, typical of appreciation-focused markets.
Year-over-year price growth of +2.1% indicates stable market conditions.
Rental Cash Flow Analysis
Monthly Income
Est. Monthly Expenses
Price Forecast 2026–2028
🔮 Sandy Price Forecast 2026–2028
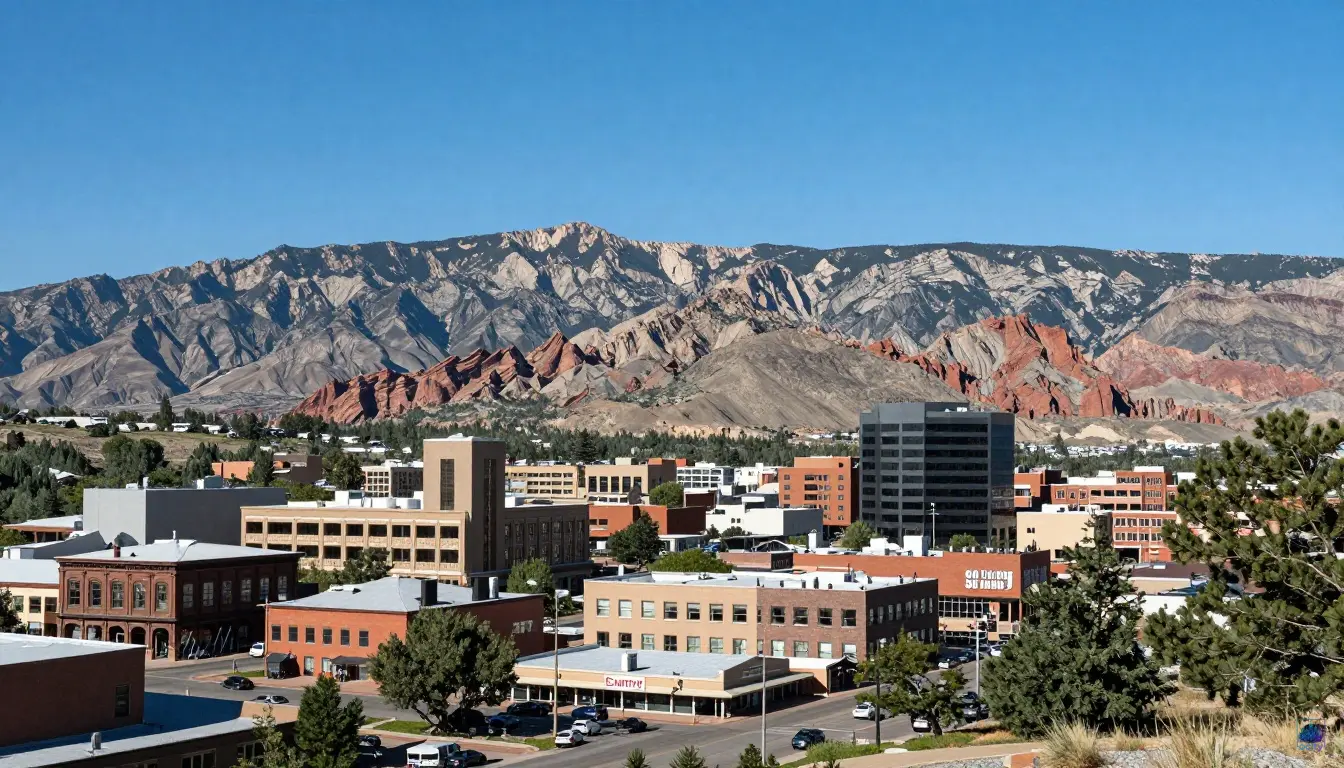
The Sandy housing market forecast for 2026-2028 points toward a period of stabilization rather than explosive growth, primarily due to stretched affordability. With a current median home price of $650,422 and a price-to-rent ratio of 37.0x, the market is significantly more expensive than the national average, making homeownership a tough proposition for many. While the 5-year CAGR of 6.4% shows strong historical appreciation, the recent YoY price change has cooled to just 1.9%, signaling a major shift. The market temperature of 62/100 indicates a balanced but cooling environment, and the "RENT" verdict is a clear signal that purchasing power is currently better utilized elsewhere.
Will Sandy home prices drop? While a significant crash is unlikely given the area's strong fundamentals and Risk Grade of A, prices are expected to flatten or see modest single-digit gains through 2027. The local economy, anchored by the tech sector and proximity to Salt Lake City, continues to provide a stable employment base, but the days on market stretching to 44 suggest buyers are gaining leverage. Affordability remains the key headwind, and as we look toward Sandy real estate in 2027, the market will likely be influenced by broader interest rate trends and the availability of new housing stock in the region. Any price corrections will likely be shallow and localized.
Ultimately, the outlook for Sandy is one of normalization. The 5-year price change of 36.9% has pulled forward much of the near-term appreciation, leaving less room for rapid gains without significant income growth or a supply constraint. For potential buyers, patience may be rewarded as inventory levels potentially rise, but for current owners, the A-grade risk assessment offers reassurance that their asset remains fundamentally sound. The next few years will likely test the market's resilience, but Sandy's desirability as a family-friendly suburb with good amenities should prevent drastic declines, even if the era of double-digit growth is temporarily on hold.
Job Market
Healthcare
Risk Factors
Market Activity
Market Position
Similar Markets Compare with cities of similar size & cost
Livonia
Lehi
Reading
Asheville
Hoover
Showing cities with similar population (46k - 138k) and cost of living index (77 - 116)
ROI Projector Estimate your total return
Adjust the sliders to model different investment scenarios for Sandy.
* Estimates based on 2.1% annual appreciation, 3% rent growth, 5% vacancy. Does not include closing costs, tax benefits, or capital gains tax. For illustrative purposes only.
Rental Investment Calculator Estimate your monthly cashflow
Rental Income Estimator
Pre-filled for Sandy
Property
Financing
Expenses
Monthly Breakdown
Investment Summary
Disclaimer: This analysis is for informational purposes only and should not be considered financial advice. Investment decisions should be made after consulting with qualified professionals. Data sources include Zillow, Census Bureau, and BLS. Cap rates and yields are estimates based on available data.
Last updated: June 2026