Investment Breakdown
Sheridan has a price-to-rent ratio of 30.8x, which indicates renting is more favorable than buying.
The estimated cap rate of 1.5% is below average, typical of appreciation-focused markets.
Year-over-year price growth of +3.5% indicates stable market conditions.
Rental Cash Flow Analysis
Monthly Income
Est. Monthly Expenses
Price Forecast 2026–2028
🔮 Sheridan Price Forecast 2026–2028
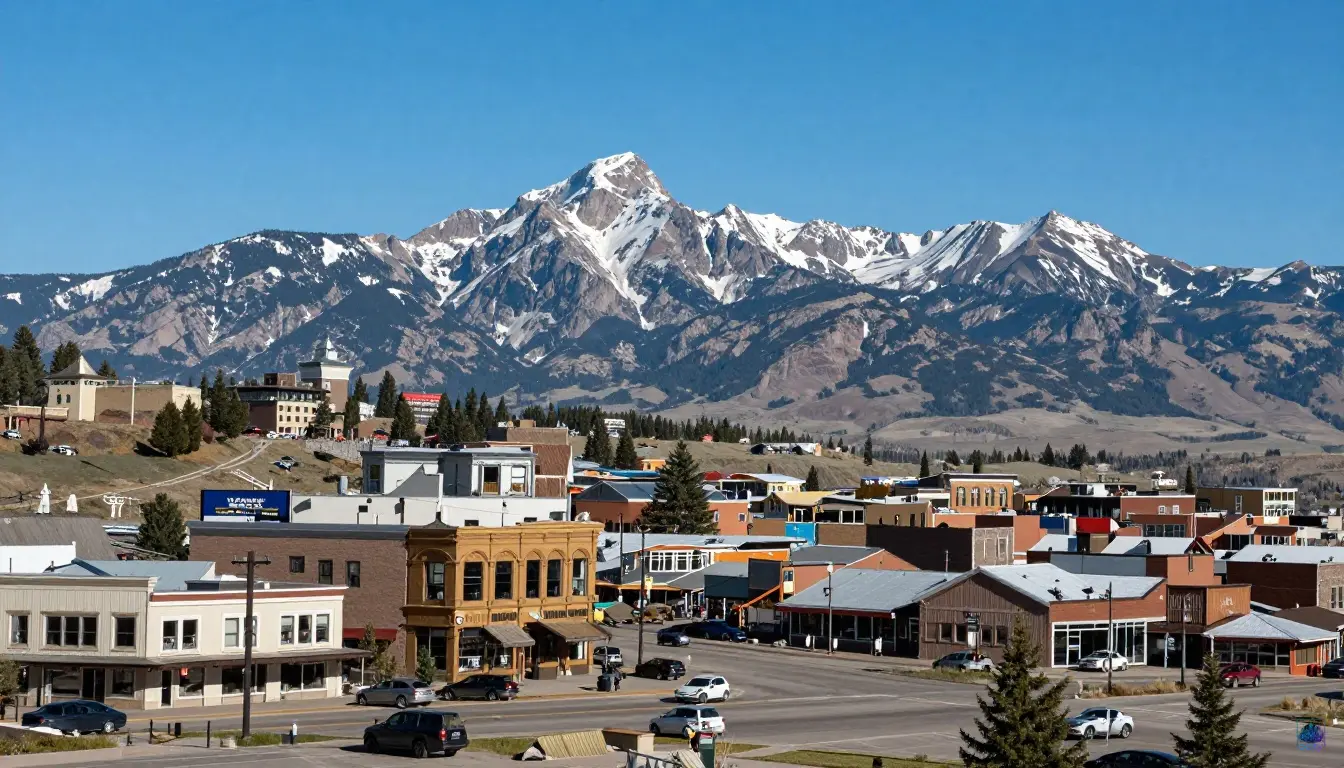
Looking ahead at the Sheridan housing market forecast for 2026-2028, the data suggests a period of moderation rather than dramatic shifts. The current median home price of $421,804 has seen a modest 2.7% year-over-year increase, a significant cooling from the 34.6% five-year price change. With a Price-to-Rent Ratio of 34.8x—well above the national average of 18x—the market is stretched, making purchasing less financially attractive than renting in the short term. This imbalance, combined with a market temperature score of 60/100, points toward a leveling-off period where price growth aligns more closely with local wage and economic fundamentals.
When asking will Sheridan home prices drop, the answer likely lies in the city's unique economic drivers rather than a broad market correction. Sheridan's economy, heavily reliant on energy, agriculture, and a growing tourism sector tied to the Bighorn Mountains, provides a stable but not explosive employment base. The affordability challenge, highlighted by the "RENT" verdict, may cap buyer demand, especially for those entering the market. However, the low risk grade of A and a relatively quick 35 days on market indicate underlying resilience and sustained interest. While external factors like interest rates will play a role, Sheridan's appeal as a lifestyle destination may provide a floor for prices, preventing significant declines.
For those tracking Sheridan real estate Sheridan 2027, the outlook is one of cautious stability. The five-year compound annual growth rate (CAGR) of 6.0% offers a more realistic benchmark for appreciation than recent highs, suggesting that sustainable growth is still achievable. Affordability will remain the central theme; if local wages do not keep pace with home values, the market could see a period of stagnation rather than growth. This forecast anticipates a balanced market where sellers must price competitively and buyers have more leverage than in previous years. Ultimately, Sheridan's market is likely to mirror its economy: steady, resilient, but not prone to the volatility seen in larger metropolitan areas.
Job Market
Healthcare
Risk Factors
Market Activity
Market Position
Similar Markets Compare with cities of similar size & cost
Augusta
Martinsburg
Rock Springs
Westerly CDP
South Burlington
Showing cities with similar population (10k - 29k) and cost of living index (78 - 116)
ROI Projector Estimate your total return
Adjust the sliders to model different investment scenarios for Sheridan.
* Estimates based on 3.5% annual appreciation, 3% rent growth, 5% vacancy. Does not include closing costs, tax benefits, or capital gains tax. For illustrative purposes only.
Rental Investment Calculator Estimate your monthly cashflow
Rental Income Estimator
Pre-filled for Sheridan
Property
Financing
Expenses
Monthly Breakdown
Investment Summary
Disclaimer: This analysis is for informational purposes only and should not be considered financial advice. Investment decisions should be made after consulting with qualified professionals. Data sources include Zillow, Census Bureau, and BLS. Cap rates and yields are estimates based on available data.
Last updated: June 2026