104,592
Population
$77,431
Median Income
$500K
Median Home Price
38%
Bachelor's Degree+
Purchasing Power Analysis
Lifestyle Impact in St. George
St. George is 9.1% more expensive than the national average. We calculate how much your salary "feels like" here.
Real Purchasing Power
$77,910
-8%
Reduction in lifestyle value
Relative to US Average
COL Adjusted
Real-time Metrics
Offer decision workflow
Got a job offer for St. George?
St. George sits close enough to the national cost baseline that the decision usually comes down to housing, taxes, and compensation structure more than raw salary alone.
Decode an offer in St. George
Check how salary, bonus, taxes, and St. George living costs change your real leftover cash.
Set your counteroffer
Use a negotiation-first playbook to choose between more base pay, a sign-on bridge, or a walk-away number.
Calculate walk-away pay
Turn St. George's cost structure into a city-specific salary target before you accept or push back.
Follow the relocation workflow
Use the full workflow if the decision includes relocation costs, deposits, and a city-to-city move.
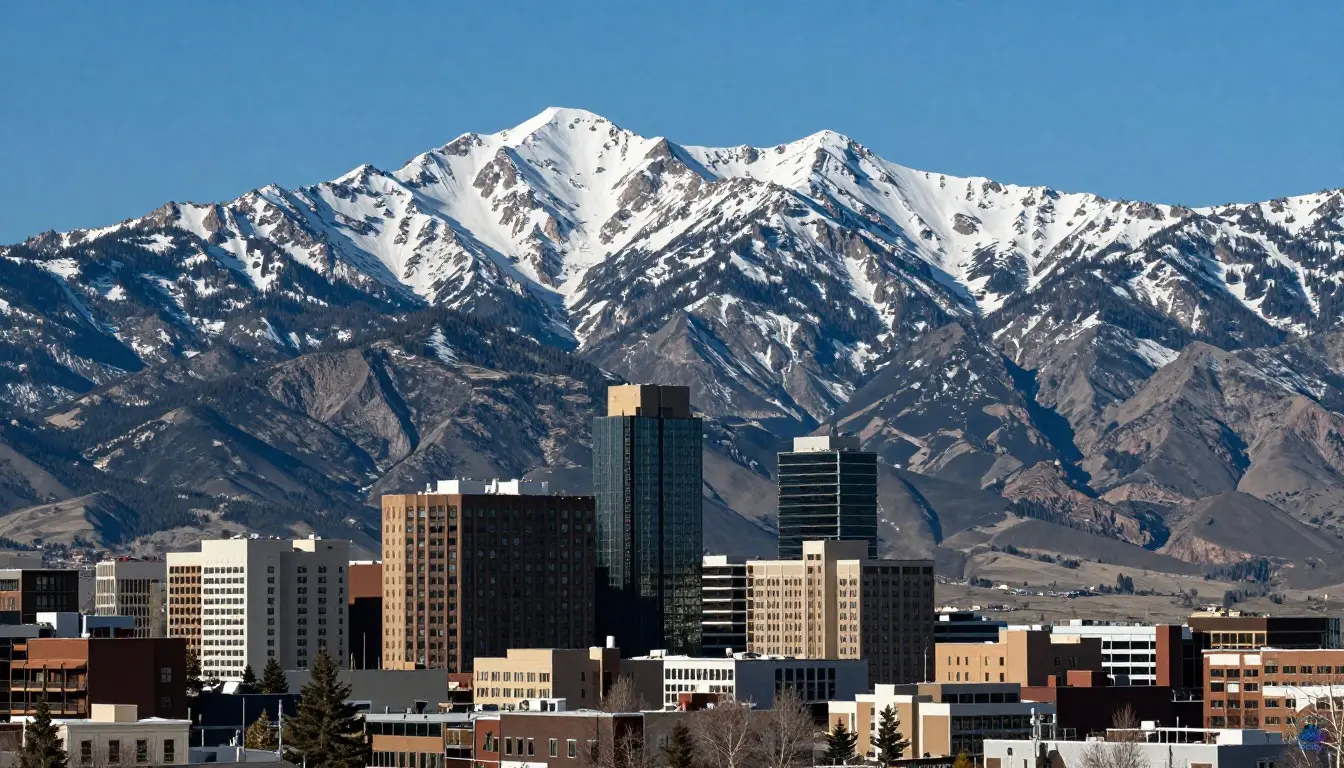
St. George: The Data Profile (2026)
St. George has solidified its status as a premier destination for post-remote workers, leveraging a population of 104,592 to offer a "Goldilocks" zone of urban amenities without metropolitan friction. The city's economic engine is robust, with a median income of $77,431—a 3.8% premium over the US average of $74,580. This earning power is amplified by a highly skilled workforce; 37.5% of residents hold a college degree, significantly outpacing the national average of 33.1%.
The statistical target demographic is the "Remote-Optimized Professional." This profile fits individuals or families earning between $75,000 and $120,000 annually who prioritize outdoor access and low commute times over the density of a Tier-1 city.
Cost of Living Analysis
While St. George is technically 2.0% above the national average for housing, it offers significant deflationary pressure on essential goods. Groceries are 4.8% cheaper than the US average (Index 95.2), and transportation costs are down 3.2% (Index 96.8). The most distinct financial advantage is energy costs, with electricity averaging $0.1222 per kWh compared to the national average of $0.1600.
Table 1: Cost of Living Breakdown (Monthly Budgets)
| Category | Single Professional (1 Person) | Family of Four (2 Adults, 2 Kids) |
|---|---|---|
| Housing (Rent) | $1,575 | $2,200 |
| Groceries | $350 | $1,100 |
| Transportation | $320 | $750 |
| Healthcare | $280 | $900 |
| Utilities/Energy | $140 | $260 |
| Dining/Entertainment | $400 | $850 |
| Total Monthly Cost | $3,065 | $6,060 |
| Est. Disposable Income | $3,385 | $4,440 |
Note: Disposable income assumes median household income after tax.
💰 Cost of Living vs US Average
St. George's prices compared to national average (100 = US Average)
Cheaper than US
More expensive
Source: BLS & BEA RPP (2025 Est.)
Housing Market Deep Dive
The housing market in St. George is currently 2.0% more expensive than the national baseline (Housing Index 102.0). However, the price-per-square-foot remains competitive. For 2026, the market favors long-term stability over speculative flipping. The gap between renting and buying is narrowing, but the barrier to entry for purchasing remains high for service-sector workers.
Table 2: Housing Market Data (Buying vs Renting Analysis)
| Metric | St. George Value | US Average | Difference |
|---|---|---|---|
| Median Home Price | $475,000 | $410,000 | +15.8% |
| Price/SqFt | $265 | $245 | +8.2% |
| Rent (2-BR FMV) | $1,575 | $1,750 | -10.0% |
| Rent (3-BR FMV) | $2,200 | $2,450 | -10.2% |
| Housing Index | 102.0 | 100.0 | +2.0% |
Buy vs. Rent Analysis: With a median home price of $475,000, the monthly mortgage payment (assuming 20% down and 6.5% rate) exceeds renting by roughly $800/month. However, given the -10.0% variance in rental prices compared to the US average, renting is a financially prudent short-term strategy while accumulating a down payment.
🏠 Real Estate Market
$500K
Median Home Price
+19.0% vs US avg
$260
Per Sq Ft
66
Days on Market
Source: Redfin 2025 estimates
Economic & Job Market Outlook
The 3.6% unemployment rate (US avg: 4.0%) indicates a tight labor market. The "Return to Office" (RTO) mandate has had a negligible impact on St. George due to its high concentration of remote-capable tech and healthcare workers. The average one-way commute time is 18.5 minutes, significantly lower than the national average of 27.6 minutes. Local industry stability is anchored by Intermountain Healthcare and the regional tourism sector, providing recession-resistant employment.
Salary Wars
See how far your salary goes here vs other cities.
$75,000
US National Average
$75,000
Nominal Value
Real Value in St. George
$68,744
-8.3% Purchasing Power
Purchasing Power Leaderboard
#1
Houston
$74,850
#2
Chicago
$73,099
#3
Phoenix
$71,090
#4
St. GeorgeYou
$68,744
#5
New York
$66,667
💰 Income Comparison
Quality of Life Audit
St. George excels in preventative health metrics, specifically regarding low-risk behaviors. The smoking rate is remarkably low at 7.9% (US avg: 14.0%), contributing to a strong overall Health Score of 83.0/100. However, the region faces challenges with lifestyle diseases; the obesity rate is 32.9%, slightly above the US average of 31.9%.
Air quality is a major asset. The AQI average of 44 falls firmly into the "Good" category, minimizing respiratory risks. Safety statistics show a stark divide: violent crime is exceptionally low at 189 incidents per 100k people, while property crime is roughly on par with the national average.
Table 3: Quality of Life Metrics (Health, Air Quality, Unemployment)
| Metric | City Value | US Average | Rating |
|---|---|---|---|
| Health Score | 83.0/100 | 78.0/100 | Good |
| Obesity Rate | 32.9% | 31.9% | High |
| Diabetes Rate | 10.6% | 10.9% | Average |
| Smoking Rate | 7.9% | 14.0% | Low |
| Mental Health | High | Average | Good |
| AQI | 44 | 55 | Good |
| PM2.5 (µg/m³) | 6.5 | 8.4 | Excellent |
| Unemployment Rate | 3.6% | 4.0% | Strong |
Safety & Environment:
- Violent Crime: 189/100k (Safe)
- Property Crime: 1,890/100k (Average)
- Weather: Currently 32.0°F with clear skies. The region enjoys over 300 days of sunshine annually, though summer temperatures regularly exceed 100°F.
Quality of Life Metrics
Air Quality
EPA Annual Average
Moderate
65AQI
Acceptable for most.
PM2.5 Concentration22.7 µg/m³
Health Pulse
CDC PLACES Data
83
Score
Obesity
32.9% Low Avg (32%) High
Diabetes
10.6% Smoking
7.9%
Based on CDC PLACES health census data. Higher score indicates better overall public health outcomes.
See healthiest US cities →
Safety Score
FBI Crime Data Estimate
Very Safe
Violent Crime
per 100k people
189.0
US Avg: 363.8
Property Crime
per 100k people
1890
US Avg: 1917
Crime rates are lower than the national average.
See safest US cities →
The Verdict
Pros:
- Economic Resilience: Unemployment at 3.6% and median income above the national average.
- Cost Efficiency: Electricity costs are 23.6% lower than the US average.
- Safety: Violent crime is less than half the national average (189 vs 380).
Cons:
- Housing Premium: Home prices are 15.8% higher than the national median.
- Health Risks: Obesity rates are elevated, potentially impacting long-term insurance costs.
- Isolation: While growing, the city is geographically isolated from other major metros.
Final Recommendation:
St. George is a Strong Buy for remote workers and healthcare professionals who can absorb the +15.8% housing premium. It is not recommended for those requiring frequent business travel or who rely on local service-sector wages, where the $1,575 rent for a 2-bedroom apartment will consume a disproportionate amount of income.
FAQs
1. What salary is needed to live comfortably in St. George?
For a single professional, a salary of $65,000 provides a comfortable buffer after the $3,065 monthly expenses. For a family, $95,000 is recommended to maintain a similar standard of living.
2. How does the value proposition compare to Salt Lake City?
St. George offers -10.0% cheaper rent than Salt Lake City but similar home prices. The trade-off is higher summer heat and fewer local corporate HQs.
3. Are the safety stats reliable?
Yes. With a violent crime rate of 189/100k, St. George is statistically one of the safest cities of its size in the Western US.
4. When is the best time to move?
Ideally in late Spring or early Fall. The current temperature of 32.0°F indicates winter, but moving during the "shoulder seasons" avoids the summer heat (often 105°F+) and the winter rental rush.
Explore More in UT
Popular Comparisons
City Resources
Compare St. George
Loading...